


Cardano price has retreated toward $0.23 after rejection at the top of an ascending parallel channel, bringing the lower boundary near $0.21 into focus as daily and 4-hour momentum weaken.
Summary
- Cardano price traded near $0.232 on Oct. 8, roughly 17% below its recent $0.28 peak.
- The daily ascending parallel channel remains intact, with its lower boundary near $0.21.
- Daily RSI fell to 46.02, while the MACD histogram turned negative.
- Ali Martinez identified $0.21 as a possible downside target if the channel rejection holds.
TradingView’s Binance ADA/USDT daily chart showed Cardano at $0.2318 on Oct. 8, with a session high of $0.2582 and a low of $0.2288. The displayed daily decline was 9.28%, extending the retreat from the early-October peak around $0.28.
ADA’s latest price was approximately 17.2% below that peak. The decline also carried the token beneath the $0.24–$0.25 area where several recent candles had traded, leaving price closer to the channel’s lower half.
Cardano’s ascending channel points toward $0.21 support
The daily chart shows ADA moving within an ascending parallel channel that stretches back to June. Two rising boundaries frame the recovery from summer lows, with the latest advance reaching the upper line near $0.27–$0.28 before reversing.
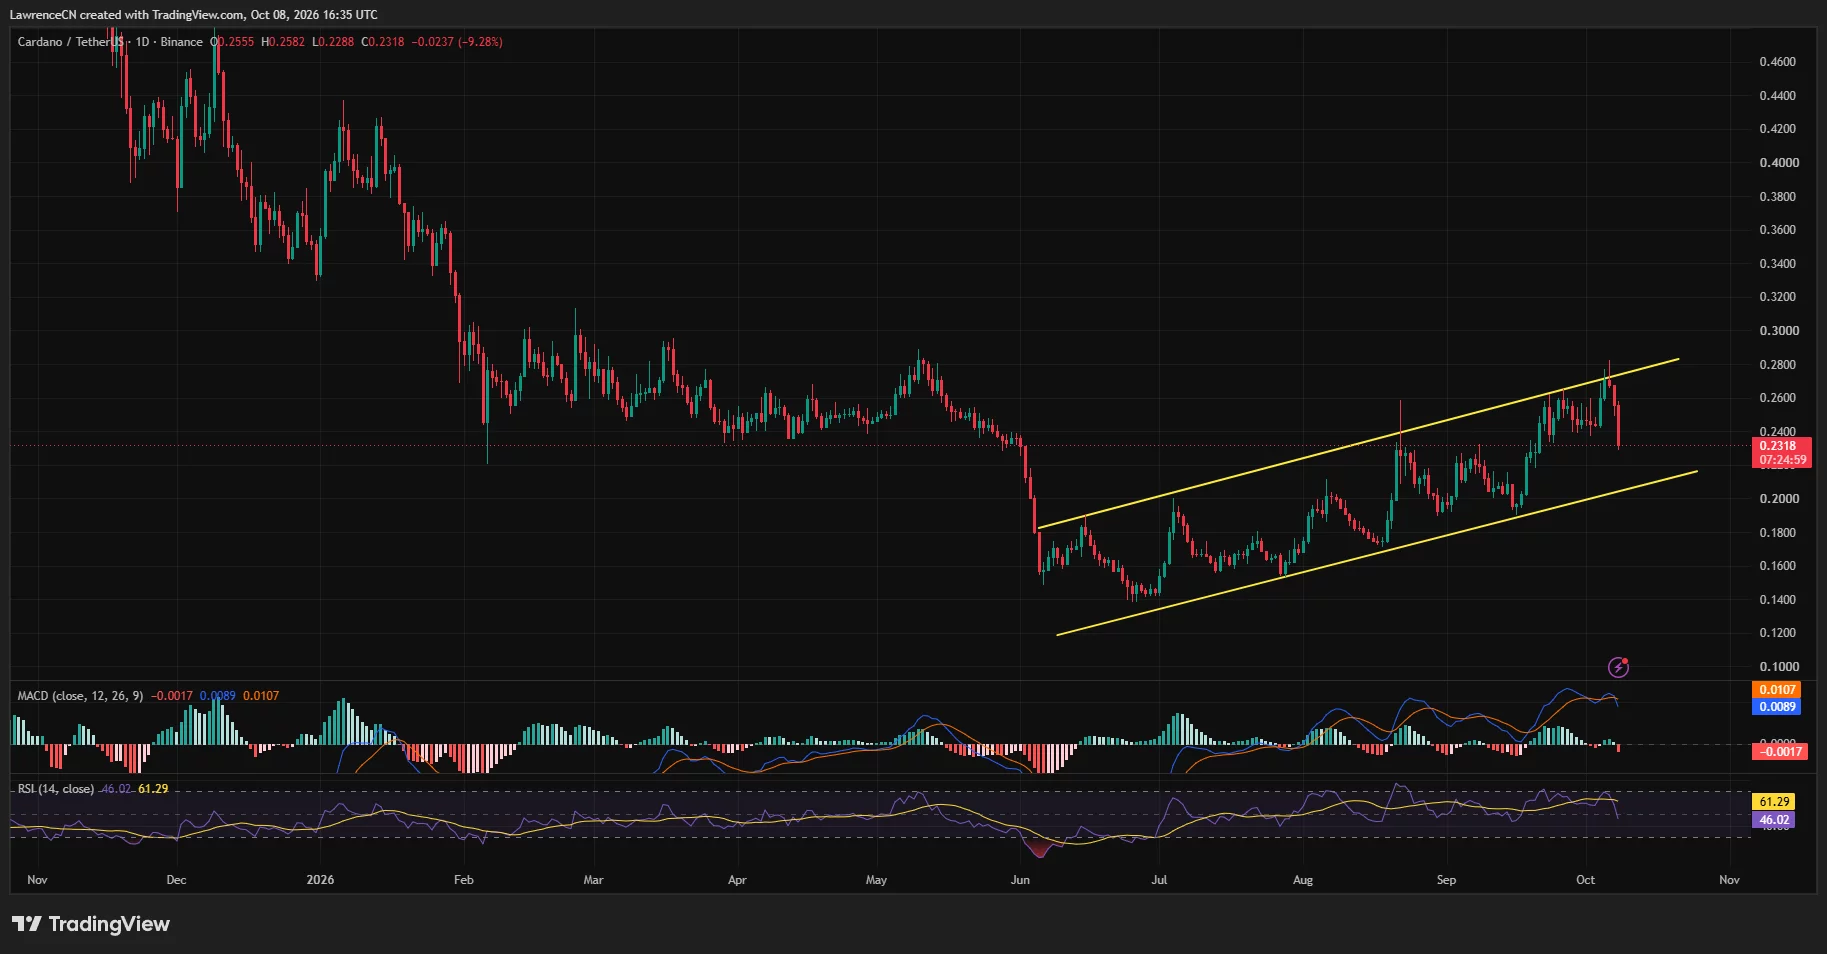
Earlier swings within the formation included a late-August advance, a September pullback and another recovery into October. The latest reversal has taken ADA away from the upper boundary without yet breaking the lower trendline.
Crypto analyst Ali Martinez identified the same rejection in an Oct. 8 post, saying Cardano could move toward the channel’s lower boundary near $0.21 if the rejection holds. His projection places the next potential channel test about 9.4% below the $0.2318 daily chart reading.
The lower boundary currently runs through roughly $0.21–$0.215 on the TradingView chart. Since the line slopes upward, its exact price changes with time rather than remaining fixed at one horizontal level.
Nearer support sits around the latest session low of $0.2288 and the $0.23 area. A sustained move beneath that zone would leave the rising channel floor as the next major reference in Martinez’s setup.
A drop toward $0.21 would still place ADA inside the broader recovery channel. A sustained break below the lower boundary would invalidate that channel structure and bring the September trading area around $0.20 into view.
Daily RSI and MACD weaken after the $0.28 rejection
TradingView’s daily relative strength index stood at 46.02, below the neutral 50 level and its displayed moving average of 61.29. The RSI had fallen sharply from the stronger readings recorded during the advance into early October.
The daily moving average convergence divergence indicator also showed a weaker configuration. Its MACD line stood at 0.0089, below the signal line at 0.0107, while the histogram registered approximately minus 0.0017.
Both MACD lines remained above zero, but the negative histogram reflected the MACD line falling beneath its signal. The chart therefore showed weakening daily momentum alongside a price structure that still retained its rising lower boundary.
A recovery above $0.24 would return ADA to the lower edge of its recent consolidation area. The next visible resistance lies around $0.25–$0.26, followed by the October high near $0.28.
The channel’s upper boundary also sits close to that recent high. Any renewed attempt to reach it would first require ADA to recover the price levels lost during the latest decline.
ADA’s 4-hour Supertrend turns bearish near $0.254
The Binance ADA/USDT 4-hour chart showed price at $0.2321, with a local high of $0.2334 and a low of $0.2288. ADA had dropped beneath the previous support area around $0.24 and below its Supertrend indicator.
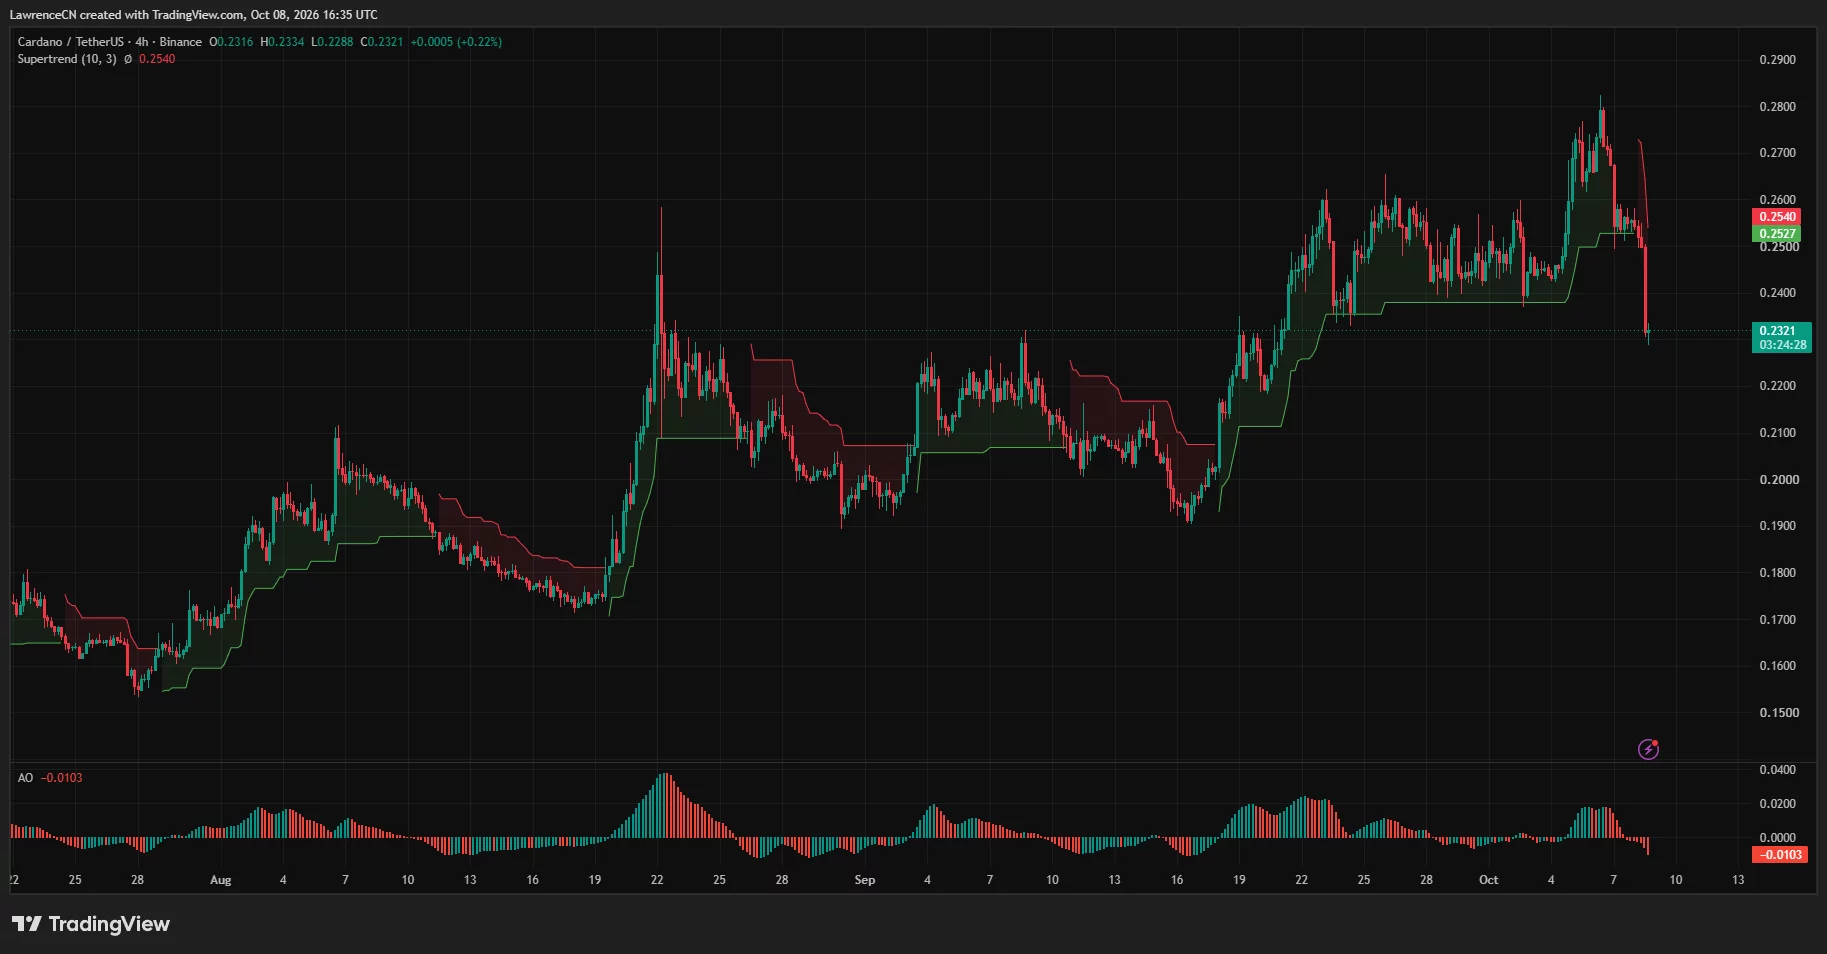
The active Supertrend reading appeared in red at $0.2540, placing the indicator above price. ADA would need a recovery of roughly 9.4% from $0.2321 just to reach that level.
The 4-hour Awesome Oscillator registered minus 0.0103. Its latest red bars extended below zero after the positive readings associated with the early-October rally.
Taken together, the price position below Supertrend and the negative oscillator show a bearish short-term configuration on the 4-hour chart. A bounce toward $0.24 would leave that configuration unresolved while price remained below the $0.254 Supertrend level.
CoinGlass’s one-week ADA liquidation heatmap showed the latest decline moving through bands around $0.245 and $0.24 before reaching the $0.23 region. Remaining visible concentrations above price included areas near $0.26 and $0.283–$0.285.
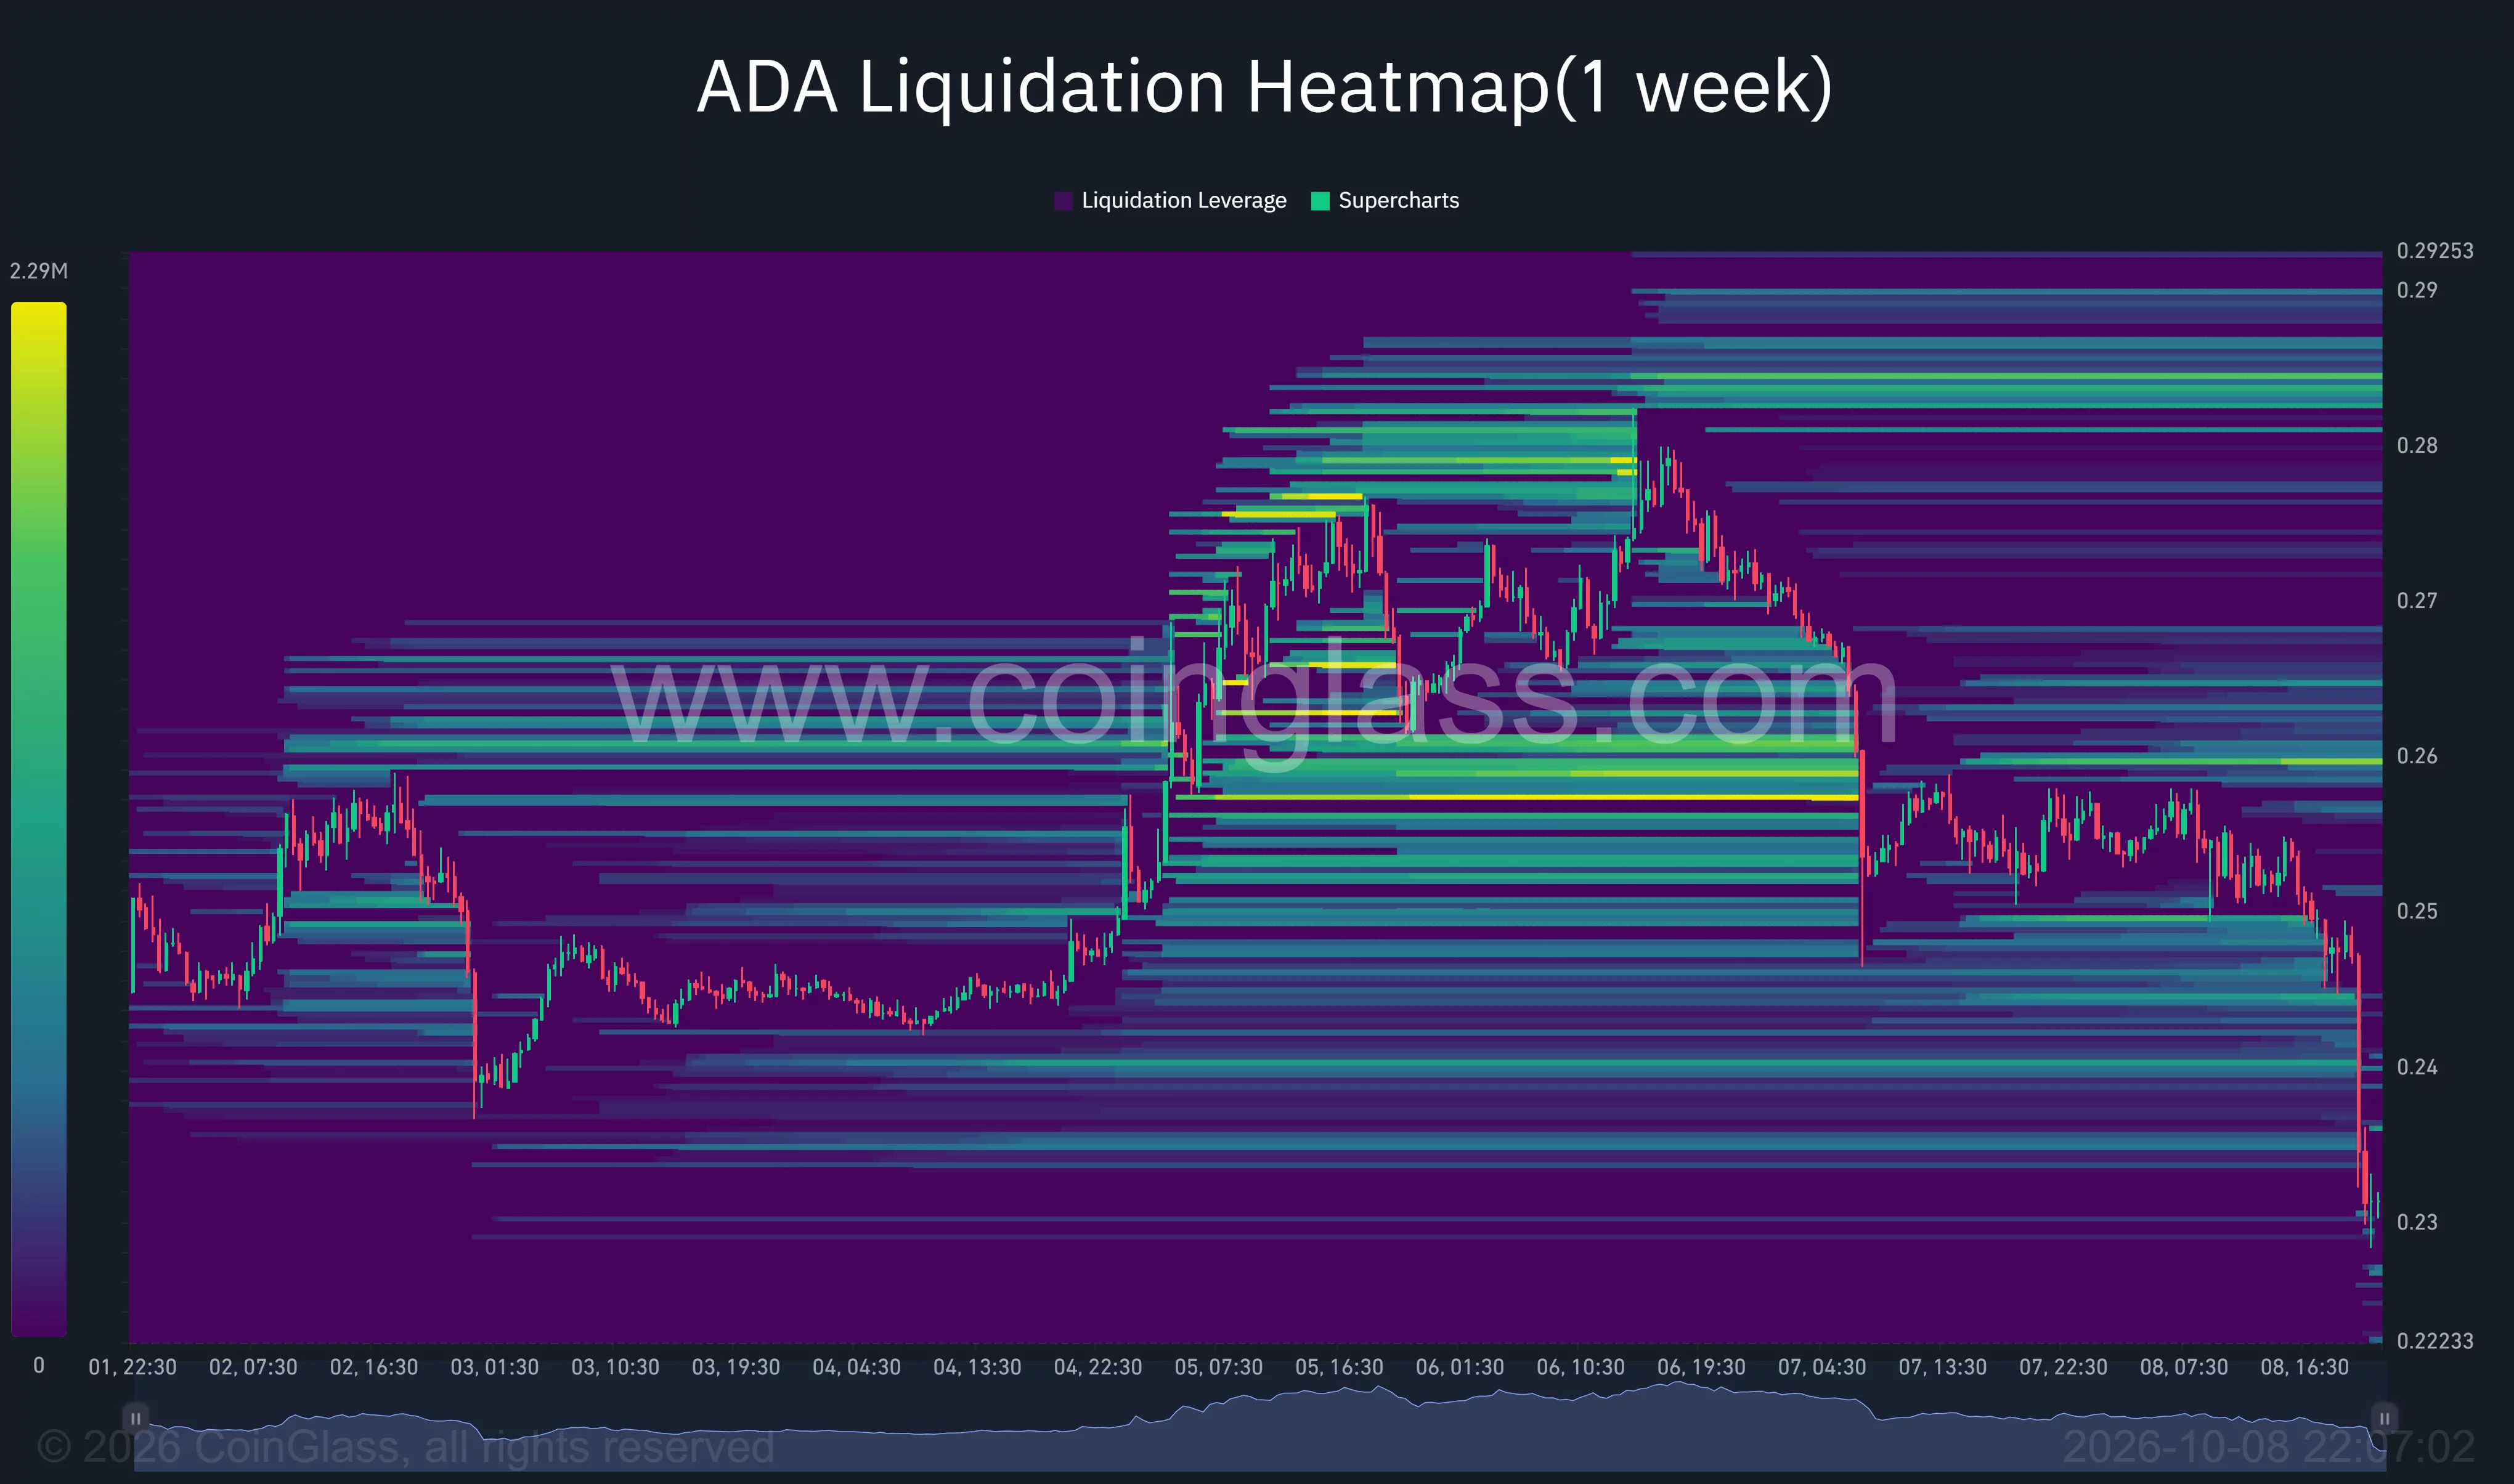
The heatmap’s brighter bands mark concentrations of estimated liquidation exposure. Those bands provide additional levels to monitor alongside the daily channel boundaries and the 4-hour Supertrend.
Cardano’s domain application advances during the pullback
The Cardano Foundation announced on Oct. 8 that its .ada application had advanced to the next phase of ICANN’s New Generic Top-Level Domain Program. The foundation said approval would bring .ada into the global internet address system alongside extensions such as .com and .org.
The foundation’s announcement also said the application followed a governance action backed by approximately 75% of community support. Approval remains conditional on the remaining ICANN process.
For U.S. market context, a September prospectus supplement for the T. Rowe Price Active Crypto ETF listed ADA among its eligible assets. The filing establishes Cardano’s eligibility within the fund’s investment universe.
On the charts, the immediate contest remains between support around $0.2288–$0.23 and resistance at $0.24, followed by $0.254. Martinez’s $0.21 scenario remains conditional on the upper-channel rejection holding, while a recovery toward $0.26–$0.28 would move ADA back toward the formation’s upper boundary.
Disclosure: This article does not represent investment advice. The content and materials featured on this page are for educational purposes only.